 Global Disposable Drinking Straws Market 2026 -
Players, Regions, Product Types, Application & Forecast Analysis
Global Disposable Drinking Straws Market 2026 -
Players, Regions, Product Types, Application & Forecast Analysis
Global Disposable Drinking Straws Market 2026 - Players, Regions, Product Types, Application & Forecast Analysis
Chapter 1 Disposable Drinking Straws Market Overview
1.1 Disposable Drinking Straws Definition
1.2 Global Disposable Drinking Straws Market Size Status and Outlook (2019-2032)
1.3 Global Disposable Drinking Straws Market Size Comparison by Region (2019-2032)
1.4 Global Disposable Drinking Straws Market Size Comparison by Type (2019-2032)
1.5 Global Disposable Drinking Straws Market Size Comparison by Application (2019-2032)
1.6 Global Disposable Drinking Straws Market Size Comparison by Sales Channel (2019-2032)
1.7 Disposable Drinking Straws Market Dynamics
1.7.1 Market Drivers/Opportunities
1.7.2 Market Challenges/Risks
1.7.3 Market News (Products Launch, Mergers, Acquisitions, Expansion, Agreement and Collaborations, Partnerships)
1.7.4 COVID-19 Impacts
1.7.5 Russia-Ukraine War Impacts
1.7.6 US-Israel-Iran War Impacts
Chapter 2 Executive Summary
2.1 Global Disposable Drinking Straws Market Snapshot
2.2 Global Disposable Drinking Straws Market Volume & Revenue (2019-2025)
2.3 Global Disposable Drinking Straws Market Differential Growth Potential Analysis by Type, (2019-2032) (USD Million)
2.4 Global Disposable Drinking Straws Market Differential Growth Potential Analysis by Application, (2019-2032) (USD Million)
2.5 Global Disposable Drinking Straws Market Differential Growth Potential Analysis by Sales Channels, (2019-2032) (USD Million)
2.6 Global Disposable Drinking Straws Market Differential Growth Potential Analysis by Region, (2019-2032) (USD Million)
Chapter 3 Disposable Drinking Straws Market Segment Analysis by Player
3.1 Global Disposable Drinking Straws Sales and Market Share by Player (2023-2025)
3.2 Global Disposable Drinking Straws Revenue and Market Share by Player (2023-2025)
3.3 Global Disposable Drinking Straws Average Price by Player (2023-2025)
3.4 Players Competition Situation & Trends (2023-2025)
3.5 Conclusion of Segment by Player
Chapter 4 Disposable Drinking Straws Market Segment Analysis by Type
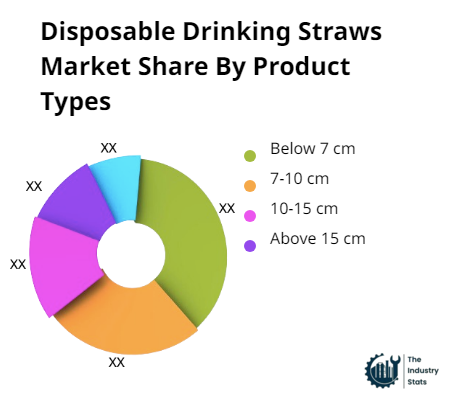
4.1 Global Disposable Drinking Straws Market by Type
4.1.1 Below 7 cm
4.1.2 7-10 cm
4.1.3 10-15 cm
4.1.4 Above 15 cm
4.2 Global Disposable Drinking Straws Sales and Market Share by Type (2019-2025)
4.3 Global Disposable Drinking Straws Revenue and Market Share by Type (2019-2025)
4.4 Global Disposable Drinking Straws Average Price by Type (2019-2025)
4.5 Leading Players of Disposable Drinking Straws by Type in 2025
4.6 Conclusion of Segment by Type
Chapter 5 Disposable Drinking Straws Market Segment Analysis by Application
5.1 Global Disposable Drinking Straws Market by Application
5.1.1 Household
5.1.2 Food Service
5.1.3 Others
5.2 Global Disposable Drinking Straws Revenue and Market Share by Application (2019-2025)
5.3 Leading Consumers of Disposable Drinking Straws by Application in 2025
5.4 Conclusion of Segment by Application
Chapter 6 Disposable Drinking Straws Market Segment Analysis by Sales Channel
6.1 Global Disposable Drinking Straws Market by Sales Channel
6.1.1 Global Disposable Drinking Straws Market, by Direct Channel Market Analysis (2019-2032) (USD Million)
6.1.2 Global Disposable Drinking Straws Market, by Distribution Channel Market Analysis (2019-2032) (USD Million)
6.2 Global Disposable Drinking Straws Revenue and Market Share by Sales Channel (2019-2025)
6.3 Leading Distributors/Dealers of Disposable Drinking Straws by Sales Channel in 2025
6.4 Conclusion of Segment by Sales Channel
Chapter 7 Disposable Drinking Straws Market Segment Analysis by Region
7.1 Global Disposable Drinking Straws Market Size and CAGR by Region (2019-2032)
7.2 Global Disposable Drinking Straws Sales and Market Share by Region (2019-2025)
7.3 Global Disposable Drinking Straws Revenue and Market Share by Region (2019-2025)
7.4 North America
7.4.1 North America Market by Country
7.4.2 North America Disposable Drinking Straws Market Share by Type
7.4.3 North America Disposable Drinking Straws Market Share by Application
7.4.4 United States
7.4.5 Canada
7.4.6 Mexico
7.5 Europe
7.5.1 Europe Market by Country
7.5.2 Europe Disposable Drinking Straws Market Share by Type
7.5.3 Europe Disposable Drinking Straws Market Share by Application
7.5.4 Germany
7.5.5 United Kingdom
7.5.6 France
7.5.7 Italy
7.5.8 Russia
7.5.9 Spain
7.5.10 Benelux
7.5.11 Poland
7.5.12 Austria
7.5.13 Portugal
7.5.14 Rest of Europe
7.6 Asia-Pacific
7.6.1 Asia-Pacific Market by Country
7.6.2 Asia-Pacific Disposable Drinking Straws Market Share by Type
7.6.3 Asia-Pacific Disposable Drinking Straws Market Share by Application
7.6.4 China
7.6.5 Japan
7.6.6 Korea
7.6.7 India
7.6.8 Southeast Asia
7.6.9 Australia
7.6.10 Taiwan
7.6.11 Rest of Asia Pacific
7.7 South America
7.7.1 South America Market by Country
7.7.2 South America Disposable Drinking Straws Market Share by Type
7.7.3 South America Disposable Drinking Straws Market Share by Application
7.7.4 Brazil
7.7.5 Argentina
7.7.6 Colombia
7.7.7 Chile
7.7.8 Peru
7.7.9 Venezuela
7.7.10 Rest of South America
7.8 Middle East & Africa
7.8.1 Middle East & Africa Market by Country
7.8.2 Middle East & Africa Disposable Drinking Straws Market Share by Type
7.8.3 Middle East & Africa Disposable Drinking Straws Market Share by Application
7.8.4 UAE
7.8.5 Saudi Arabia
7.8.6 South Africa
7.8.7 Egypt
7.8.8 Nigeria
7.9.9 Rest of Middle East & Africa
7.9 Conclusion of Segment by Region
Chapter 8 Profile of Leading Disposable Drinking Straws Players
8.1 Huhtamaki
8.1.1 Company Snapshot
8.1.2 Product/Service Offered
8.1.3 Business Performance (Sales, Price, Revenue, Gross Margin and Market Share)
8.1.4 Recent Developments
8.2 Footprint LLC
8.2.1 Company Snapshot
8.2.2 Product/Service Offered
8.2.3 Business Performance (Sales, Price, Revenue, Gross Margin and Market Share)
8.2.4 Recent Developments
8.3 Hoffmaster Group (Aardvark)
8.3.1 Company Snapshot
8.3.2 Product/Service Offered
8.3.3 Business Performance (Sales, Price, Revenue, Gross Margin and Market Share)
8.3.4 Recent Developments
8.4 Biopac
8.4.1 Company Snapshot
8.4.2 Product/Service Offered
8.4.3 Business Performance (Sales, Price, Revenue, Gross Margin and Market Share)
8.4.4 Recent Developments
8.5 Vegware
8.5.1 Company Snapshot
8.5.2 Product/Service Offered
8.5.3 Business Performance (Sales, Price, Revenue, Gross Margin and Market Share)
8.5.4 Recent Developments
8.6 TIPI Straws
8.6.1 Company Snapshot
8.6.2 Product/Service Offered
8.6.3 Business Performance (Sales, Price, Revenue, Gross Margin and Market Share)
8.6.4 Recent Developments
8.7 Austraw Pty Ltd
8.7.1 Company Snapshot
8.7.2 Product/Service Offered
8.7.3 Business Performance (Sales, Price, Revenue, Gross Margin and Market Share)
8.7.4 Recent Developments
8.8 Okstraw
8.8.1 Company Snapshot
8.8.2 Product/Service Offered
8.8.3 Business Performance (Sales, Price, Revenue, Gross Margin and Market Share)
8.8.4 Recent Developments
8.9 The Blue Straw
8.9.1 Company Snapshot
8.9.2 Product/Service Offered
8.9.3 Business Performance (Sales, Price, Revenue, Gross Margin and Market Share)
8.9.4 Recent Developments
8.10 PT. Strawland
8.10.1 Company Snapshot
8.10.2 Product/Service Offered
8.10.3 Business Performance (Sales, Price, Revenue, Gross Margin and Market Share)
8.10.4 Recent Developments
8.11 Tetra Pak
8.11.1 Company Snapshot
8.11.2 Product/Service Offered
8.11.3 Business Performance (Sales, Price, Revenue, Gross Margin and Market Share)
8.11.4 Recent Developments
8.12 R&M Plastic Products
8.12.1 Company Snapshot
8.12.2 Product/Service Offered
8.12.3 Business Performance (Sales, Price, Revenue, Gross Margin and Market Share)
8.12.4 Recent Developments
8.13 Transcend Packaging
8.13.1 Company Snapshot
8.13.2 Product/Service Offered
8.13.3 Business Performance (Sales, Price, Revenue, Gross Margin and Market Share)
8.13.4 Recent Developments
8.14 MPM Marketing Services
8.14.1 Company Snapshot
8.14.2 Product/Service Offered
8.14.3 Business Performance (Sales, Price, Revenue, Gross Margin and Market Share)
8.14.4 Recent Developments
8.15 Nippon Straw
8.15.1 Company Snapshot
8.15.2 Product/Service Offered
8.15.3 Business Performance (Sales, Price, Revenue, Gross Margin and Market Share)
8.15.4 Recent Developments
8.16 Canada Brown Eco Products
8.16.1 Company Snapshot
8.16.2 Product/Service Offered
8.16.3 Business Performance (Sales, Price, Revenue, Gross Margin and Market Share)
8.16.4 Recent Developments
8.17 GP Paper Straw Sdn Bhd
8.17.1 Company Snapshot
8.17.2 Product/Service Offered
8.17.3 Business Performance (Sales, Price, Revenue, Gross Margin and Market Share)
8.17.4 Recent Developments
8.18 B & B Straw Pack
8.18.1 Company Snapshot
8.18.2 Product/Service Offered
8.18.3 Business Performance (Sales, Price, Revenue, Gross Margin and Market Share)
8.18.4 Recent Developments
8.19 Aleco Straws
8.19.1 Company Snapshot
8.19.2 Product/Service Offered
8.19.3 Business Performance (Sales, Price, Revenue, Gross Margin and Market Share)
8.19.4 Recent Developments
8.20 Zhengzhou Gstar Plastics
8.20.1 Company Snapshot
8.20.2 Product/Service Offered
8.20.3 Business Performance (Sales, Price, Revenue, Gross Margin and Market Share)
8.20.4 Recent Developments
8.21 YIWU JinDong Paper
8.21.1 Company Snapshot
8.21.2 Product/Service Offered
8.21.3 Business Performance (Sales, Price, Revenue, Gross Margin and Market Share)
8.21.4 Recent Developments
8.22 Others
8.22.1 Company Snapshot
8.22.2 Product/Service Offered
8.22.3 Business Performance (Sales, Price, Revenue, Gross Margin and Market Share)
8.22.4 Recent Developments
Chapter 9 Upstream and Downstream Analysis of Disposable Drinking Straws
9.1 Industrial Chain of Disposable Drinking Straws
9.2 Upstream of Disposable Drinking Straws
9.2.1 Raw Materials (If Applicable)
9.2.2 Manufacturing Cost Structure (If Applicable)
9.2.3 Manufacturing Process (If Applicable)
9.3 Downstream of Disposable Drinking Straws
9.3.1 Leading Distributors/Dealers of Disposable Drinking Straws
9.3.2 Leading Consumers of Disposable Drinking Straws
Chapter 10. Global Disposable Drinking Straws Market Industry Analysis
10.1. Porter's Five Forces Analysis
10.1.1. Threat of New Entrants
10.1.2. Bargaining Power of Buyers/Consumers
10.1.3. Bargaining Power of Suppliers
10.1.4. Threat of Substitute Types
10.1.5. Intensity of Competitive Rivalry
10.2. Major Growth Avenues within Global Disposable Drinking Straws Market
10.2.1. Product Types
10.2.2. Applications
10.2.3. Sales Channels
10.2.4. Country
10.3. Disposable Drinking Straws Industry Ecosystem
10.4. Price Trend Analysis (If Applicable)
10.5. Buying Criteria (If Applicable)
10.6. Regulations (If Applicable)
Chapter 11 Development Trend of Disposable Drinking Straws (2026-2032)
11.1 Global Disposable Drinking Straws Market Size (Sales and Revenue) Forecast (2026-2032)
11.2 Global Disposable Drinking Straws Market Size and CAGR Forecast by Region (2026-2032)
11.3 Global Disposable Drinking Straws Market Size and CAGR Forecast by Type (2026-2032)
11.4 Global Disposable Drinking Straws Market Size and CAGR Forecast by Application (2026-2032)
11.5 Global Disposable Drinking Straws Market Size and CAGR Forecast by Sales Channel (2026-2032)
Chapter 12. Import - Export Analysis (If Applicable)
12.1 North America Disposable Drinking Straws Import-Export (2019-2025)
12.2 Europe Disposable Drinking Straws Import-Export (2019-2025)
12.3 Asia Pacific Disposable Drinking Straws Import-Export (2019-2025)
12.4 South America Disposable Drinking Straws Import-Export (2019-2025)
12.5 Middle East & Africa Disposable Drinking Straws Import-Export (2019-2025)
Chapter 13. Demand-Supply Gap Analysis
13.1 North America Disposable Drinking Straws Demand-Supply (2019-2025)
13.2 Europe Disposable Drinking Straws Demand-Supply (2019-2025)
13.3 Asia Pacific Disposable Drinking Straws Demand-Supply (2019-2025)
13.4 South America Disposable Drinking Straws Demand-Supply (2019-2025)
13.5 Middle East & Africa Disposable Drinking Straws Demand-Supply (2019-2025)
Chapter 14 Appendix
14.1 Research Methodology
14.2 Data Sources

We are ISO 9001:2015 recognized that ensures quality services and product delivery to our clients.

We are GDPR and CCPA compliant! Your transaction & personal information is protected from unauthorized use.